Hero Image
CI/CD & Production Infrastructure for a Social App

Production Infrastructure & CI/CD for a Social App Launch Client Puzzle Master β€” a social matching platform Challenge The startup had a production-ready Nest.js backend and Angular frontend, but zero infrastructure: deployments were manual, there was no CI/CD, no monitoring, no backups, and no separation between dev and prod environments. The goal was to build a complete DevOps stack from scratch before the public launch. Solution 1. Application Containerization Multi-stage Dockerfile for backend (Nest.js + Prisma, non-root user) Multi-stage Dockerfile for frontend (Angular 12, legacy OpenSSL, Nginx for static assets) Docker Compose full stack: PostgreSQL 15, Redis 7, imgproxy, Nginx Healthchecks and depends_on for correct startup ordering Isolated dev and prod environments in /opt/dev and /opt/prod 2. GitLab CI/CD Migration of repository from Bitbucket to GitLab Pipeline for backend and frontend: build β†’ push β†’ deploy GitLab Container Registry for Docker image storage Automatic deploy to dev on every push; manual trigger for prod SSH deployment to VPS via SSH_PRIVATE_KEY 3. Nginx Reverse Proxy Environment-agnostic config via envsubst for dev/prod parity SSL/TLS (TLSv1.2, TLSv1.3) with Cloudflare certificates Routing: /api/* β†’ backend:4000, /* β†’ frontend:80 www β†’ root domain redirect (301) Separate imgproxy stack with SSL termination 4. Security (Ansible) Server hardening via Ansible: SSH key-only auth, root login disabled UFW Firewall: only ports 80, 443, and custom SSH open Database accessible only via SSH tunnel All secrets stored in GitLab CI/CD variables 5. Monitoring Prometheus + Grafana with automated dashboard provisioning Exporters: Node, cAdvisor, Postgres, Redis, Nginx, Blackbox 5 Grafana dashboards: server, Docker containers, PostgreSQL, Redis, Nginx Alertmanager with Slack/webhook integration; alerts on CPU/RAM/Disk/API/SSL 6. Database Backups Automated pg_dump every hour gzip compression and upload to S3-compatible object storage (Cloudflare R2) Prometheus backup metrics: success status, size, timestamp Alerts: DatabaseBackupMissing, DatabaseBackupFailed, DatabaseBackupSizeAnomaly Technologies GitLab CI Docker Ansible Prometheus Nginx PostgreSQL Results βœ… Deploy: git push to main β†’ automatic build and deploy to server βœ… Environments: full dev/prod isolation on a single VPS βœ… Monitoring: 5 dashboards, alerts across 6 categories βœ… Backups: automated hourly pg_dump to Cloudflare R2 βœ… Security: UFW, key-based SSH, database inaccessible from outside βœ… Scalability: architecture ready for database extraction to a dedicated server

Hero Image
Geo-Distributed Blockchain Node Cluster in Kubernetes

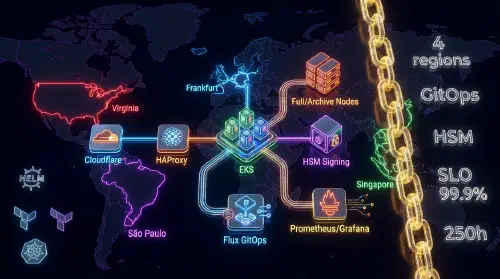
Geo-Distributed Blockchain Node Cluster in Kubernetes Client Cryptocurrency platform (Web3 / DeFi) Challenge The client needed fault-tolerant infrastructure to run ETH and BSC full nodes across four regions (EU, US, AP, LatAm) with minimal latency for end users, DDoS and RPC spam protection, secure HSM-based transaction signing, and centralized observability. Cold node sync takes 2–3 weeks β€” a fast-bootstrap solution was required. Solution 1. Infrastructure & IaC (Terraform + EKS) Terraform modules: VPC, subnets, security groups for 4 regions (Frankfurt, Virginia, Singapore, SΓ£o Paulo) Managed Kubernetes (EKS 1.29+) per region with dedicated node pools: full nodes, archive nodes, signing service NVMe StorageClass (gp3) via CSI driver for high-performance chaindata storage Helm charts for geth / bsc-node with per-region custom values 2. GitOps: Flux CD Multi-Cluster Flux CD v2 with Kustomization per region β€” single source of truth for all clusters Secrets management: HashiCorp Vault + External Secrets Operator (ESO) All infrastructure changes applied via git push β€” no direct cluster access required 3. Load Balancing & Anti-Spam HAProxy 2.8: sticky sessions, health checks via eth_syncing β€” traffic routed only to fully synced nodes Nginx Ingress: rate limiting, IP reputation filtering (Lua-based, fail2ban-style) Cloudflare Workers: geo-routing + L7 DDoS protection Custom Go sidecar: health endpoint returns ready only when node is fully synced 4. HSM Integration for Transaction Signing AWS CloudHSM (prod) / YubiHSM2 (staging) for private key storage Go microservice with PKCS#11 abstraction β€” swap HSM vendor without rewriting code Isolated K8s namespace + NetworkPolicy: no egress except to HSM endpoint gRPC API for backend: sign tx, get pubkey Full audit log of all signing operations β†’ Loki 5. Monitoring & Alerting Custom Prometheus exporter (Go): eth_blockNumber, eth_syncing, peer count per node Grafana dashboards: sync lag, block height per region, RPC latency, SLO 99.9% Alertmanager β†’ PagerDuty: alerts on block lag > N blocks, node down, peer count below threshold Loki + Promtail: structured logs from all nodes with region/pod correlation 6. Operations & Disaster Recovery Snapshot bootstrap: chaindata from S3 via rclone β€” node ready in hours instead of weeks DR playbook: step-by-step runbooks for regional recovery Chaos Engineering (Chaos Mesh): node kill, network partition, pod failure tests Architecture Decision Records (ADR) for all key design choices Technologies Kubernetes Terraform Helm Flux CD Prometheus Grafana Results βœ… Geo-routing: latency reduced by routing users to the nearest region βœ… Fast bootstrap: node ready in hours via S3 snapshot instead of 2–3 weeks of sync βœ… Anti-spam: rate limiting + IP reputation β€” public RPC handles bot load without degradation βœ… HSM: private keys never leave the hardware module βœ… GitOps: every infrastructure change goes through git with a full audit trail βœ… SLO 99.9%: tracked in Grafana, PagerDuty alerts on any degradation

Hero Image
Prometheus + Grafana Monitoring Stack

Observability Stack for Microservices Architecture Client Early-stage startup Challenge After migrating to a microservices architecture (15+ services), the team had no centralized monitoring in place. Issues were only discovered through user complaints β€” typically 30+ minutes after they occurred. A full observability stack was needed to detect and diagnose problems proactively. Solution 1. Monitoring Architecture Prometheus for metrics collection Grafana for visualization Loki for centralized log aggregation Jaeger for distributed tracing Alertmanager for notifications 2. Metrics Collection Automatic service discovery in Kubernetes Application-level custom metrics System metrics via node-exporter Database metrics via postgres-exporter and redis-exporter 3. Grafana Dashboards Per-service dashboards for each microservice Unified infrastructure overview dashboard SLA/SLO tracking metrics Business metrics (RPS, conversion rate) 4. Centralized Logging (Loki) Log aggregation across all services Full-text log search via Grafana Log-to-metric correlation 5. Distributed Tracing (Jaeger) HTTP request tracing across services Call chain visualization Bottleneck identification Per-service latency analysis 6. Alerting Alerts delivered to Slack / PagerDuty / custom webhooks Critical issue escalation On-call rotation support Automatic incident creation Technologies Prometheus Grafana Kubernetes Docker Helm Linux Results βœ… MTTD: reduced from 30 minutes to under 1 minute βœ… MTTR: recovery time reduced by 60% βœ… Alerts: proactive notifications before users are impacted βœ… Visibility: full observability across all services βœ… Capacity planning: data-driven resource forecasting