Geo-Distributed Blockchain Node Cluster in Kubernetes
Geo-Distributed Blockchain Node Cluster in Kubernetes Client Cryptocurrency platform (Web3 / DeFi)
Challenge The client needed fault-tolerant infrastructure to run ETH and BSC full nodes across four regions (EU, US, AP, LatAm) with minimal latency for end users, DDoS and RPC spam protection, secure HSM-based transaction signing, and centralized observability. Cold node sync takes 2–3 weeks — a fast-bootstrap solution was required.
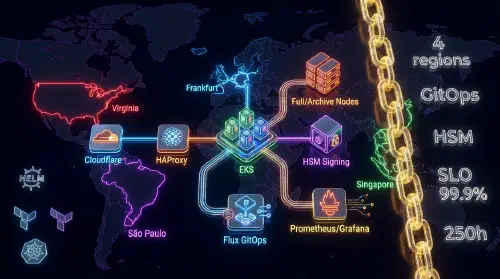
Solution 1. Infrastructure & IaC (Terraform + EKS) Terraform modules: VPC, subnets, security groups for 4 regions (Frankfurt, Virginia, Singapore, São Paulo) Managed Kubernetes (EKS 1.29+) per region with dedicated node pools: full nodes, archive nodes, signing service NVMe StorageClass (gp3) via CSI driver for high-performance chaindata storage Helm charts for geth / bsc-node with per-region custom values 2. GitOps: Flux CD Multi-Cluster Flux CD v2 with Kustomization per region — single source of truth for all clusters Secrets management: HashiCorp Vault + External Secrets Operator (ESO) All infrastructure changes applied via git push — no direct cluster access required 3. Load Balancing & Anti-Spam HAProxy 2.8: sticky sessions, health checks via eth_syncing — traffic routed only to fully synced nodes Nginx Ingress: rate limiting, IP reputation filtering (Lua-based, fail2ban-style) Cloudflare Workers: geo-routing + L7 DDoS protection Custom Go sidecar: health endpoint returns ready only when node is fully synced 4. HSM Integration for Transaction Signing AWS CloudHSM (prod) / YubiHSM2 (staging) for private key storage Go microservice with PKCS#11 abstraction — swap HSM vendor without rewriting code Isolated K8s namespace + NetworkPolicy: no egress except to HSM endpoint gRPC API for backend: sign tx, get pubkey Full audit log of all signing operations → Loki 5. Monitoring & Alerting Custom Prometheus exporter (Go): eth_blockNumber, eth_syncing, peer count per node Grafana dashboards: sync lag, block height per region, RPC latency, SLO 99.9% Alertmanager → PagerDuty: alerts on block lag > N blocks, node down, peer count below threshold Loki + Promtail: structured logs from all nodes with region/pod correlation 6. Operations & Disaster Recovery Snapshot bootstrap: chaindata from S3 via rclone — node ready in hours instead of weeks DR playbook: step-by-step runbooks for regional recovery Chaos Engineering (Chaos Mesh): node kill, network partition, pod failure tests Architecture Decision Records (ADR) for all key design choices Technologies Kubernetes Terraform Helm Flux CD Prometheus Grafana Results ✅ Geo-routing: latency reduced by routing users to the nearest region
✅ Fast bootstrap: node ready in hours via S3 snapshot instead of 2–3 weeks of sync
✅ Anti-spam: rate limiting + IP reputation — public RPC handles bot load without degradation
✅ HSM: private keys never leave the hardware module
✅ GitOps: every infrastructure change goes through git with a full audit trail
✅ SLO 99.9%: tracked in Grafana, PagerDuty alerts on any degradation